Debugging
_
Defining and Describing Debugging

Debugging is the disciplined process of finding, understanding, and removing the causes of incorrect or unexpected behavior in software systems, especially under real-world load and complexity in a startup or scaling organization.
In an innovation context, debugging covers everything from stepping through a single function in an IDE to tracing a multi-service production incident across APIs, data pipelines, and user workflows.
[7uwqao]
[6so3lj]
It applies when there is observable misbehavior (errors, performance regressions, wrong outputs, data inconsistencies) and you need to isolate the underlying cause; it does not apply to blue‑sky ideation or purely strategic questions with no falsifiable “bug.”
[7uwqao]
[5tnraw]
An innovation consultant cares about debugging because the speed and quality of a team’s debugging practice directly affects time‑to-fix, customer trust, engineering morale, and ultimately the organization’s ability to experiment safely and scale complex systems.
[7uwqao]
[5tnraw]
Disambiguation
Primary sense — the innovation-consulting sense
Definition:In innovation and startup practice, debugging is the systematic, tool‑supported process by which teams identify, reproduce, analyze, and fix defects or misbehavior in software and data systems in order to restore correct operation and learn about system dynamics.
[7uwqao]
[6so3lj]
[5tnraw]
- Scope in modern teams. Debugging typically combines interactive tools (e.g., debuggers that let you step through flows and inspect state), instrumentation (logs, traces, metrics), and profilers that replay or observe execution, such as entity or workflow profilers used to capture and replay real execution contexts for local analysis. [h77cdv] [7uwqao] [6so3lj]
- Multi-layer behavior, not just code. In real systems, debugging often spans configuration, orchestration, and data, not only source code: for example, a flow debugger runs an entire workflow “with additional processes to display contextual data” so designers can see how data transforms at each step to ensure a flow runs without errors. [7uwqao] Similarly, a profiler can stream runtime data from an application into a separate visual debugger to provide “real-time” insight into how a data-access layer behaves under load. [h77cdv]
- What debugging is NOT. Debugging is not generic performance benchmarking or capacity planning; flow debuggers explicitly warn that they should “not be used to gauge a Flow’s performance” because the additional introspection overhead distorts timing. [7uwqao] Nor is debugging the same as testing: tests aim to prevent bugs and detect regressions, while debugging is what you do after a test or production signal reveals that something is wrong.
- Organizational practice. In scaling organizations, debugging becomes a cross‑functional practice: operational tools (like “live debugging” with non‑breaking breakpoints that capture snapshots in production) have to be governed with explicit permissions and policies so engineers can inspect issues safely without impacting end users. [5tnraw] Innovation consultants often assess whether teams have adequate tooling, access, and process to debug across environments (local, staging, production) and across system boundaries (monolith ↔ microservices, app ↔ data platform). [7uwqao] [5tnraw]
Other senses
1. Debugging as developer‑tool mode or feature
Definition:Many platforms and SaaS tools use debugging to refer to a specific mode, app, or feature that allows users to inspect and troubleshoot flows, workflows, or runtime behavior inside that system.
[7uwqao]
[6so3lj]
[5tnraw]
- Business process platforms provide a dedicated Flow Debugger that can be accessed directly from a visual designer to run flows with extra instrumentation, view data transformations step by step, and locate where errors occur. [7uwqao]
- Application observability vendors expose “Live Debugging” features that let authorized users add non-breaking breakpoints and capture snapshots from running applications, with explicit permission models for who may add breakpoints and view debug data. [5tnraw]
- Workflow engines and low‑code platforms sometimes bundle profilers and replay tools (e.g., plug‑in profilers that capture the full execution context of a workflow activity and then replay it locally in an IDE) under the umbrella of debugging capabilities. [6so3lj]
2. Debugging as profiling / diagnostic analysis in data layers
Definition:Some tools use debugging to describe profiling and diagnostic analysis of database or ORM behavior, focusing on queries, performance, and usage patterns rather than logic errors in business code.
[h77cdv]
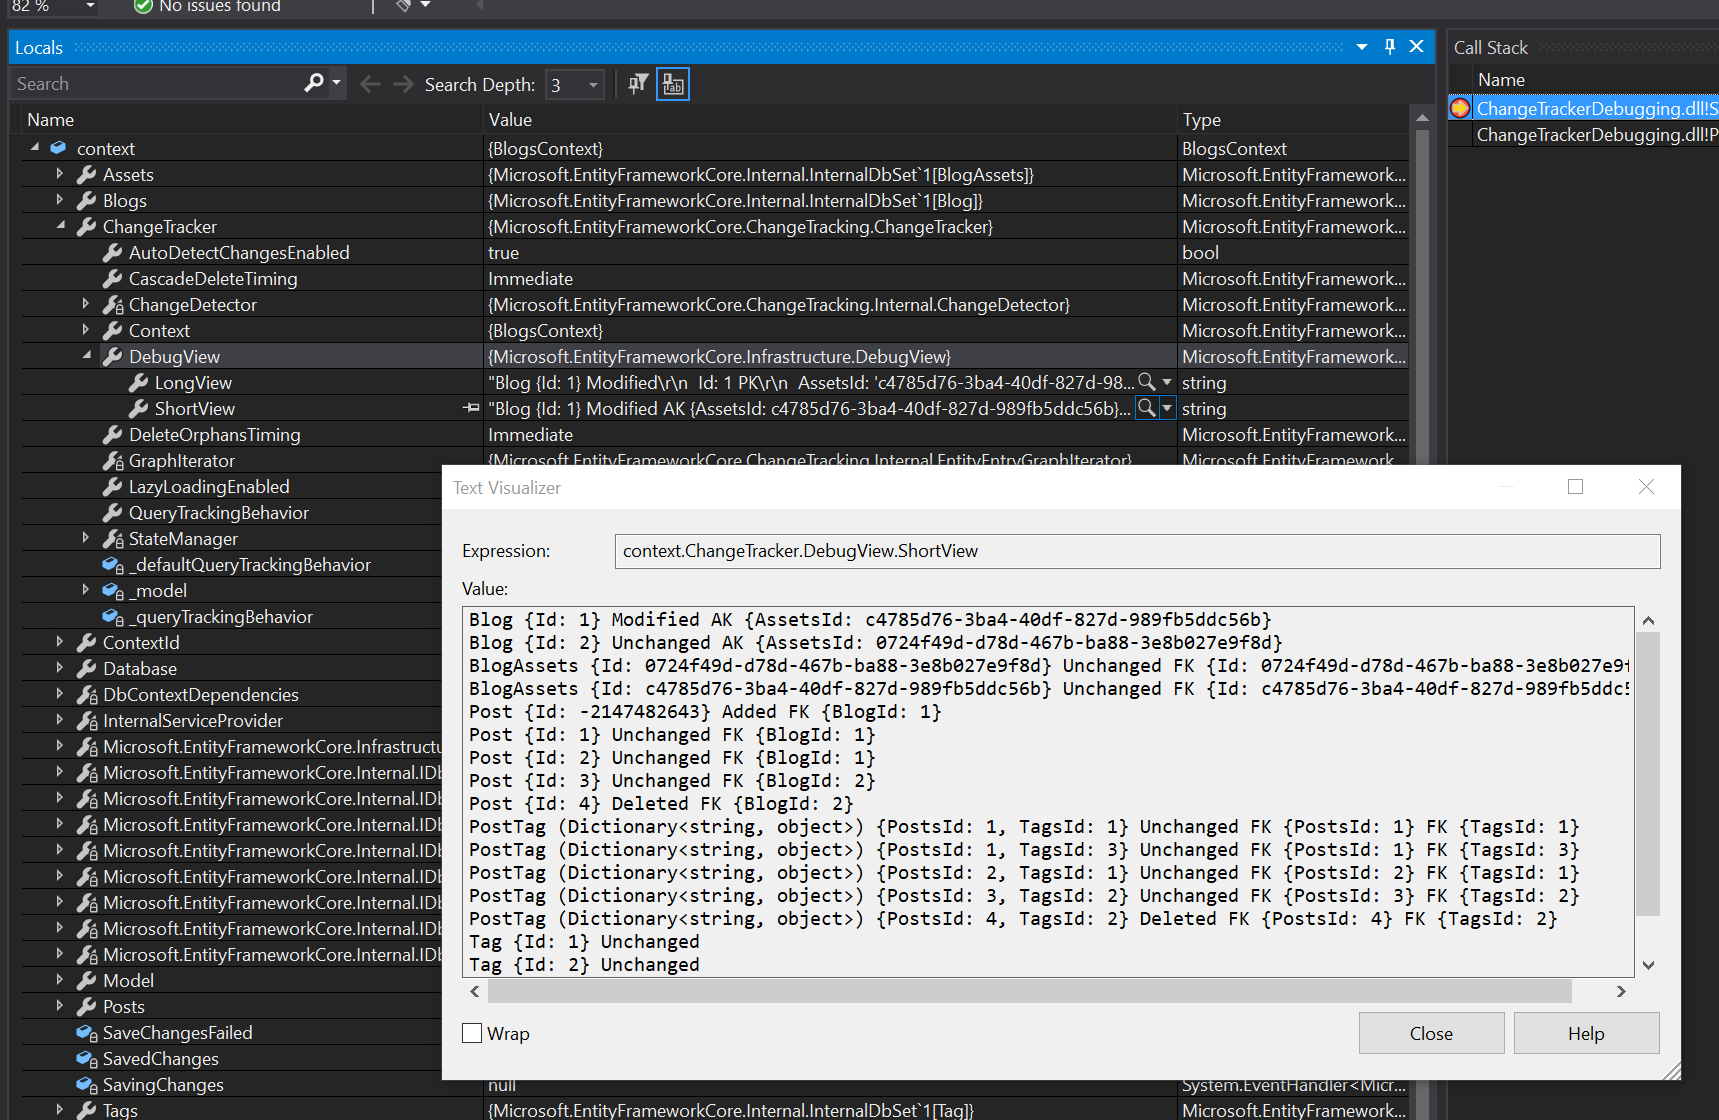
- A real‑time visual profiler for an object–relational mapper (ORM) is described as a “visual debugger” that streams information from running applications so developers can see how queries execute, how entities are loaded, and where inefficiencies lie. [h77cdv]
- These profilers integrate with applications via initialization hooks and then send runtime data to an external UI, effectively letting teams “debug” how the data access layer behaves—including N+1 query patterns, missing indexes, and other issues that affect scalability in production. [h77cdv]
3. Generic / other fields
- Also used in general computing to mean removing bugs from programs in the most generic sense, as well as in more niche tooling contexts (e.g., “debugging a mapping profile” in data-mapping libraries); these do not introduce additional innovation‑specific nuance beyond the primary sense and are not treated separately here. [53lexy]
Etymology and Origin
- The computing term “debugging” is historically traced to early computer engineering, where “bugs” referred to faults in hardware or software; a famous anecdote describes engineers removing an actual moth from a relay and logging it as the first “bug,” after which “debugging” became the act of removing such faults. [1fhcrm] [7uwqao]
- Over time, as programming practices matured, debugging migrated from hardware faults to software logic errors and then into broader system and workflow troubleshooting, including flows, workflows, and data platforms that now ship their own debuggers and profilers. [h77cdv] [7uwqao] [6so3lj] [5tnraw]
- In innovation and startup vocabulary, debugging was absorbed as software became central to product delivery; today, it encompasses not only writing and fixing code but also diagnosing complex, distributed application behaviors through live debugging, profilers, and visual flow debuggers embedded in business platforms. [h77cdv] [7uwqao] [6so3lj] [5tnraw]
Adjacent Vocabulary
- Synonyms
- Instrumentation and profiling – related to how you observe systems during debugging; profiling tools are sometimes branded as “visual debuggers” when focused on runtime behavior rather than logic correctness. [h77cdv]
- Antonyms
- Adjacent terms
- Observability Platforms – logs, metrics, and traces that make debugging complex systems possible. [5tnraw]
- Incident response – coordinated process for handling production failures in which debugging is a core technical activity. [5tnraw]
- Root cause analysis – structured follow‑up analysis that often builds on prior debugging work. [7uwqao] [6so3lj]
- Continuous Delivery – release practice whose fast cycles demand efficient debugging to keep changes safe.
- Developer Experience – includes how easily engineers can debug issues using tools like debuggers, profilers, and live debugging features. [h77cdv] [7uwqao] [5tnraw]
- Testing Frameworks – complements debugging by catching regressions early, though debugging is still required when tests fail. [7uwqao] [6so3lj]
Usage in Practice
- A workflow-platform vendor explains that the purpose of its Flow Debugger is “to ensure a Flow runs without errors” and to let designers “view how data transforms in the Flow,” emphasizing debugging as seeing and correcting behavior step by step rather than just reading code. [7uwqao]
- Documentation for a workflow engine emphasizes that a plug‑in profiler “enables replay that you can use to debug the logic in your code locally using Visual Studio,” highlighting a pattern where real execution context is captured from the platform and replayed in a developer’s environment for deeper debugging. [6so3lj]
- A data-access tooling provider markets its ORM profiler as “a real-time visual debugger which allows you to gain valuable insight and perspective of your Entity Framework usage,” positioning debugging as gaining operational understanding, not just fixing crashes. [h77cdv]
- An application observability tool describes “Live Debugging” as an app where engineers can add “non-breaking breakpoints” and see snapshots, with permissions required “to use and manage the app, add non-breaking breakpoints, and view Live Debugging snapshots,” which shows debugging embedded directly into production observability workflows. [5tnraw]
Common Misuses
- Using “debugging” for greenfield design decisions. Product or architecture discussions with no concrete error are sometimes described as “debugging our strategy”; here strategy review, design exploration, or architecture evaluation are better terms, since debugging implies a known or suspected defect.
- Equating “debug mode” with debugging discipline. Turning on a platform’s debug mode or flow debugger is sometimes treated as sufficient; the more accurate concept is a full root‑cause analysis and fix implementation, since genuine debugging also includes reproducing, understanding, and resolving the issue, not just looking at verbose logs. [7uwqao] [6so3lj]