


Data Visualizations
(2025-10-02T16:57.580Z)
Perplexity Query
(2025-10-02T16:57
.580Z)
Question:
Write a comprehensive one-page article about "Data Visualizations".
Model: sonar-pro
Data Visualizations: Turning Numbers into Narrative
Data visualization is the practice of transforming raw data into visual formats—such as charts, graphs, and interactive dashboards—that make complex information easy to understand and interpret.
[uqlk2g]
[zh6jgu]
As data continues to proliferate across industries, the significance of visualization lies in its power to distill vast and complex datasets into clear, actionable insights, enabling informed and efficient decision-making by organizations and individuals.
[9rt9j6]
[uqlk2g]
Understanding Data Visualization
At its core, data visualization is the translation of data and information into a visual context, allowing viewers to see patterns, trends, and outliers at a glance.
[zh6jgu]
Traditional forms include bar charts, line graphs, scatter plots, and maps, but modern visualization extends to dynamic dashboards and interactive interfaces that support real-time exploration.
[uqlk2g]
In practical terms, visualization serves industries and roles of all types:
- Healthcare providers use heatmaps and trend analyses to monitor patient outcomes or track disease outbreaks. For example, dashboards at institutions like Cleveland Clinic help clinicians quickly identify spikes in infection rates, improving patient care without requiring deep data science skills. [9rt9j6] [zh6jgu]
- Retailers and e-commerce businesses employ sales dashboards to track inventory levels and customer preferences, allowing for swift adjustments in marketing and stock strategies. [zh6jgu]
- Technology companies rely on real-time dashboards to monitor operational metrics. Uber, for instance, leverages visualization platforms to match riders with drivers instantly, improving efficiency and customer experience. [9rt9j6]
- Media organizations like The New York Times use interactive stories to communicate complex social or political outcomes, fostering broader public understanding and engagement. [9rt9j6]
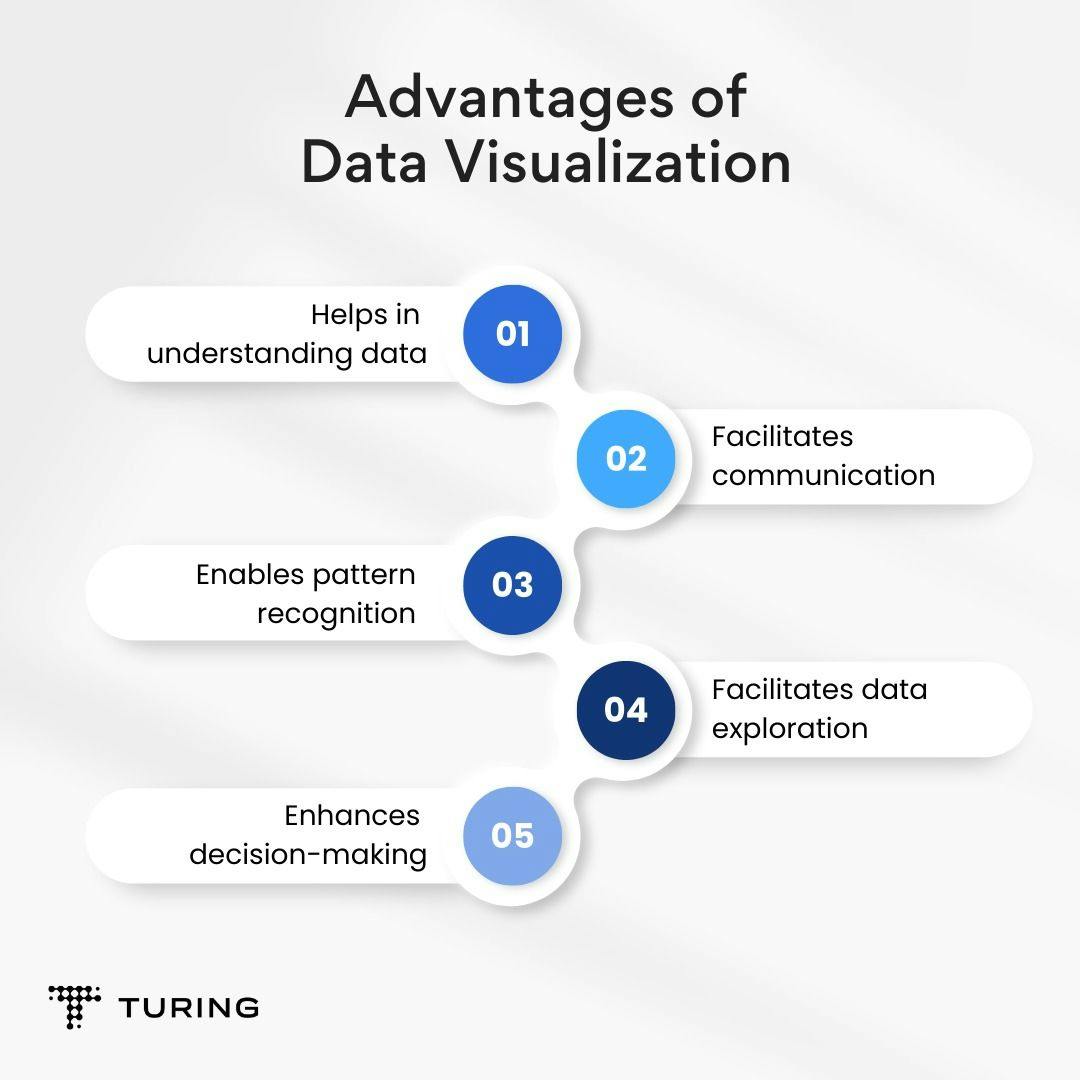
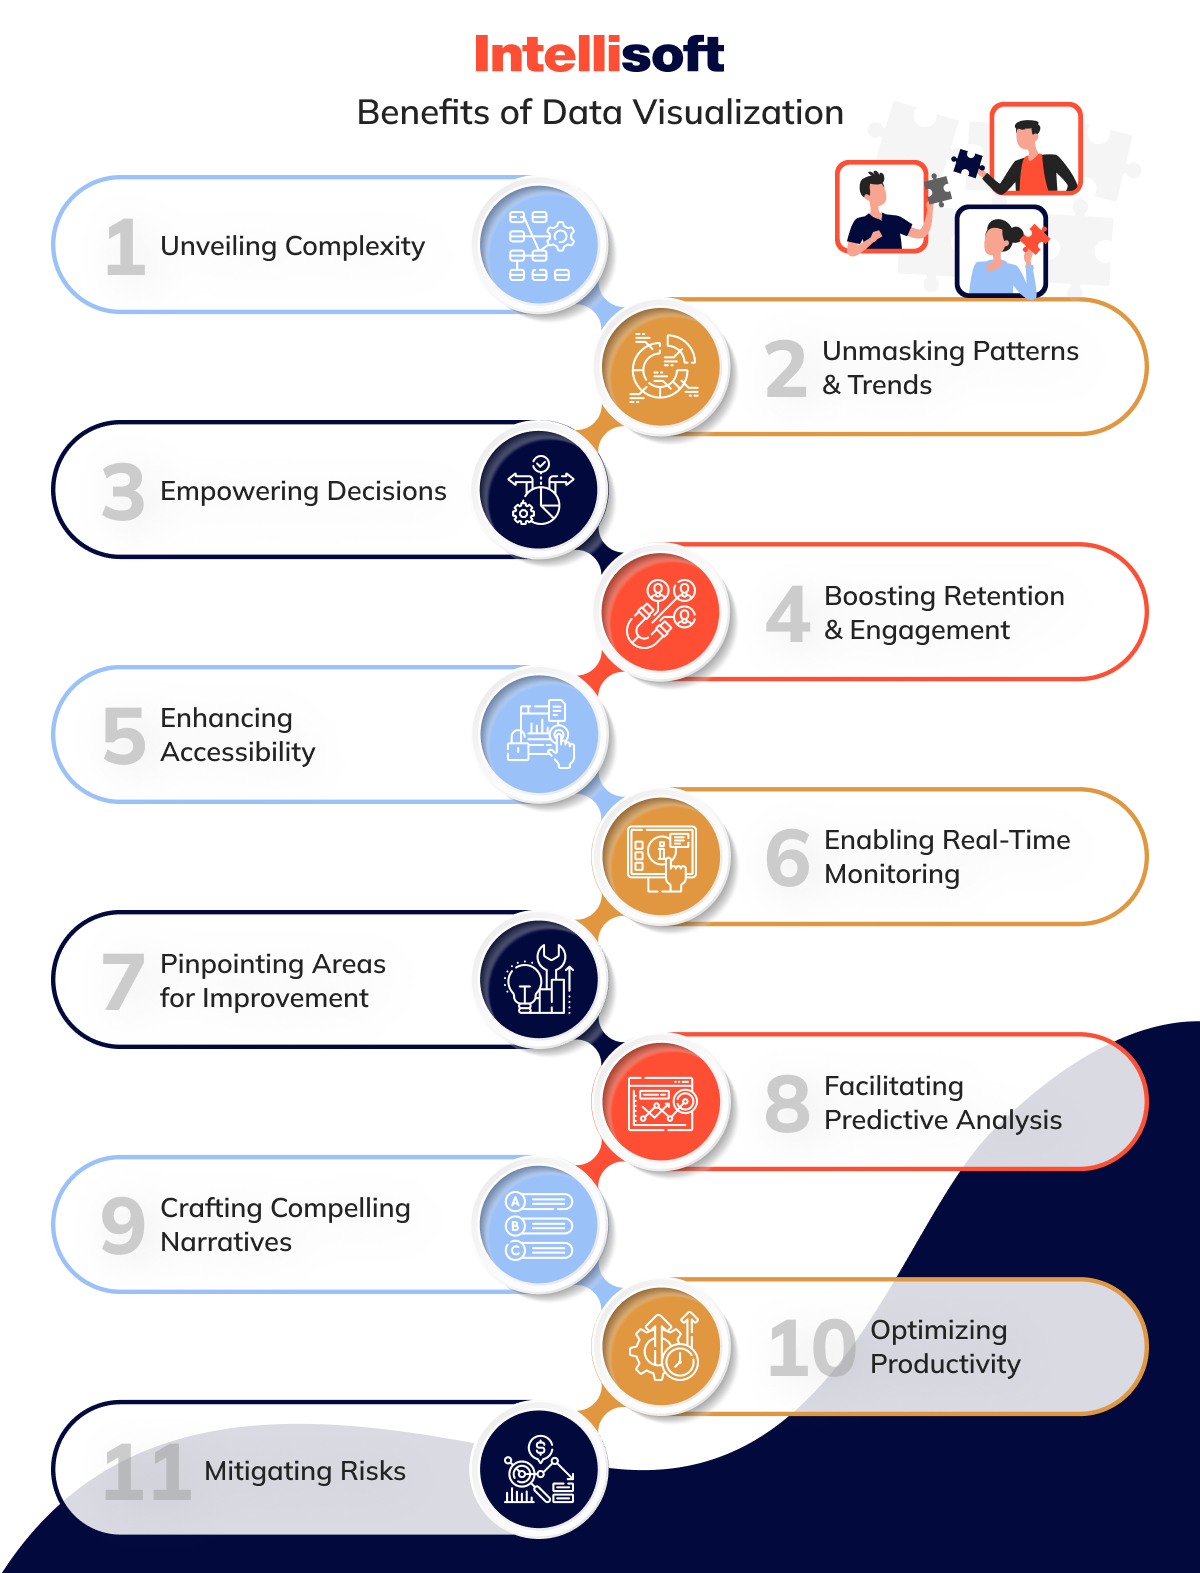
Benefits and Applications
Key benefits of data visualization include:
- Enhanced communication and storytelling: Visualization bridges the technical gap between data specialists and business users. For example, shared dashboards in banks like JPMorgan Chase align trading, compliance, and risk teams with real-time insights. [9rt9j6]
However, effective data visualization demands attention to data quality, context, and design principles. Poorly structured visuals can mislead or obscure important findings, highlighting the need for clear objectives and thoughtful presentation.
[uqlk2g]
[v07av4]
As datasets grow, ensuring privacy, managing data variety, and avoiding information overload are ongoing challenges.
Current State and Trends
The adoption of data visualization has soared as businesses recognize its strategic value. Market-leading platforms like Tableau, PowerBI, and Looker offer increasingly sophisticated, intuitive tools for creating interactive dashboards and infographics.
[uqlk2g]
[v07av4]
Many organizations now embed visualization into everyday workflows, from marketing analysis to supply chain management.
Recent trends include the rise of AI-powered and automated visualizations, where algorithms suggest optimal formats or even generate entire dashboards based on user queries. Data storytelling, which blends narrative context with visual analytics, has become a standard approach in journalism and consulting alike.
[uqlk2g]

Future Outlook
The future of data visualization is likely to see deeper integration with artificial intelligence, enabling more predictive, automated, and personalized experiences. Emerging technologies—such as augmented and virtual reality—promise immersive analytics, making complex insights even more accessible to non-experts. As collaboration platforms improve, expect visual data to become a universal language for innovation, strategy, and social change.
Conclusion
Data visualization transforms abstract numbers into narratives that drive clarity, engagement, and better decision-making. As data grows ever more central to modern life, developing and deploying effective visualizations will be crucial in harnessing its full potential for everyone.
Citations
[9rt9j6] 2025, Oct 02. Benefits of Data Visualization: Turning Data into Insights - Acceldata. Published: 2024-11-12 | Updated: 2025-10-02
[uqlk2g] 2025, Oct 02. What is Data Visualization? Benefits and Techniques | Amplitude. Published: 2025-05-27 | Updated: 2025-10-02
[zh6jgu] 2025, Oct 02. What is Data Visualization and Why is It Important? - GeeksforGeeks. Published: 2025-07-31 | Updated: 2025-10-02
[v07av4] 2025, Oct 02. What Is Data Visualization? Key Benefits, Types, and How It Works. Published: 2011-01-01 | Updated: 2025-10-02
[5]: 2025, Oct 02. Data Visualization: Definition, Benefits, and Examples - Coursera. Published: 2025-01-15 | Updated: 2025-10-02
[6]: 2025, Oct 01. What Is Data Visualization? Benefits, Types & Best Practices. Published: 2025-03-28 | Updated: 2025-10-01
[7]: 2025, Oct 01. Data Visualization: Benefits, Techniques, and Industry Examples. Published: 2025-09-12 | Updated: 2025-10-01
[8]: 2025, Oct 02. The Five Benefits of Data Visualization | Deloitte Netherlands. Published: 2022-05-06 | Updated: 2025-10-02
[9]: 2025, Oct 01. What is Data Visualization & Why Is It Important? - Sigma Computing. Published: 2023-08-08 | Updated: 2025-10-01